Badgeboard - GitHub actions, where is my CI dashboard!
- Posted on December 04, 2019
- management, software development
- By Carlos Camacho
A widely used term in the agile world is the information radiator, which refers to display the project’s critical information as simple as possible. These information radiators improve the team’s communication by amplifying pieces of data to get a better notion of self-awareness.
TL;DR;
If you just want to go straight to the solution of how to convert SVG badges to a widget-based CI dashboard, just go to the Badgeboard repository or open the demo.
Otherwise, continue reading.
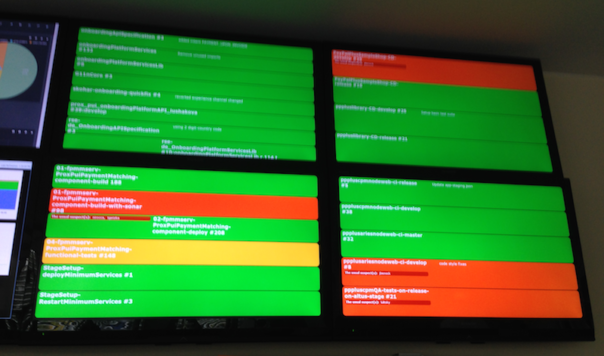
If you are beginning to apply agile methodologies in your team, a good information radiator can be for example a CI status dashboard.
The purpose of this information radiators, as the name implies, is to radiate information. It is something that people know about it and can see it easily. Keep in mind that a good information radiator will adapt to the needs of the project throughout its life, so try not to invest too much time in its initial design, and make sure that it can be easily changed/fixed/used/improved.
Some features of these information radiators:
- It reflects the now: Information radiators always show what is going on (if things are going north or south). They help us see what matters now to the team and what to focus on in most of the cases when we hit i.e. regressions.
- Minimum maximum value information: Simple and highly valuable. The more information, the less focus on important information, and more effort to maintain the panel.
- Must be alive: This information artifact should be updated each time. As soon as reality changes, the artifact status should also change.
CI Dashboards
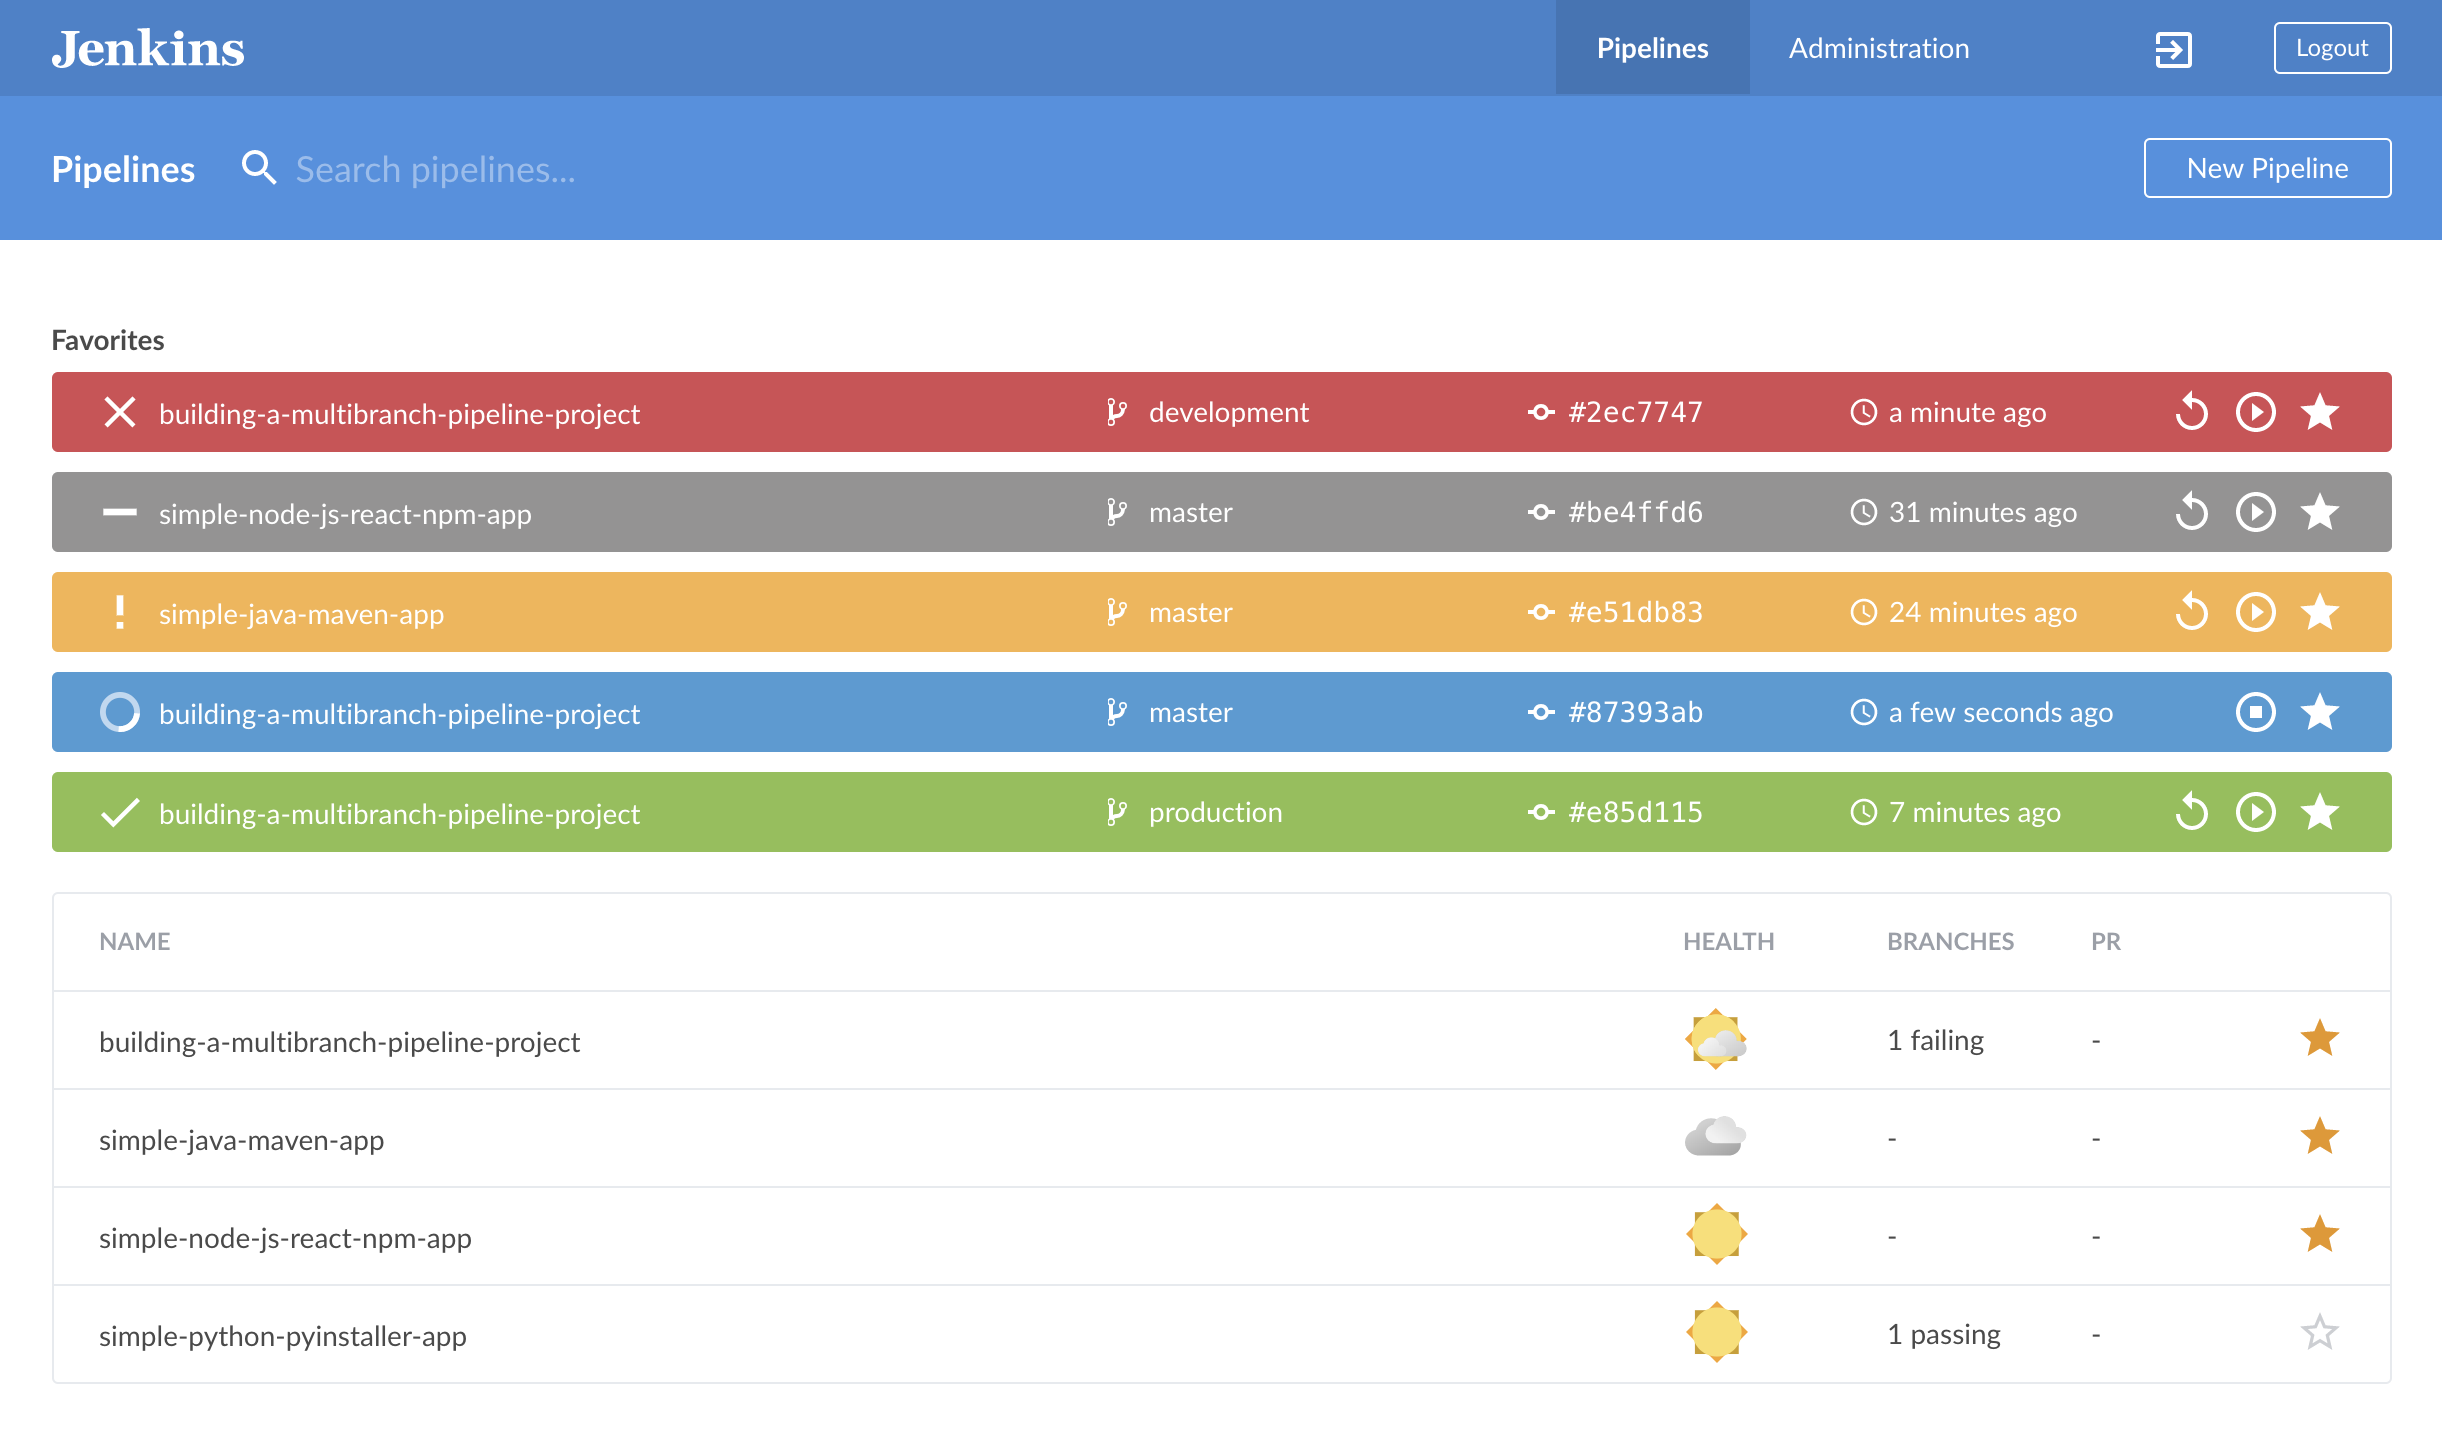
CI dashboards are a graphical representation of the continuous integration test results, usually HTML based and displaying in colors (red, yellow and green) the actual tests running results.
GitHub badges
We can see the status badges as a brief summary of the CI pipeline status. Badges1 are a unified way to present condensed pieces of information about your projects. They are also considered as any visual token of achievement, affiliation, authorization, or other trust relationship.
They consist of a small image and additionally a URL that the image points to. Examples for badges can be the pipeline status, test coverage, or ways to contact the project maintainers.

What now?
We introduce a tool to convert SVG badges to CI dasboards (Badgeboard).
GitHub actions -> No CI dashboard by default :(
I really liked the big dashboard view printed on a big screen so everyone can see it in a quick and easy manner. So, if we start using i.e. GitHub actions we lose the ability to have this graphical representation towards a badge based view.
Yehi!!! Here we have badgeboard!!!
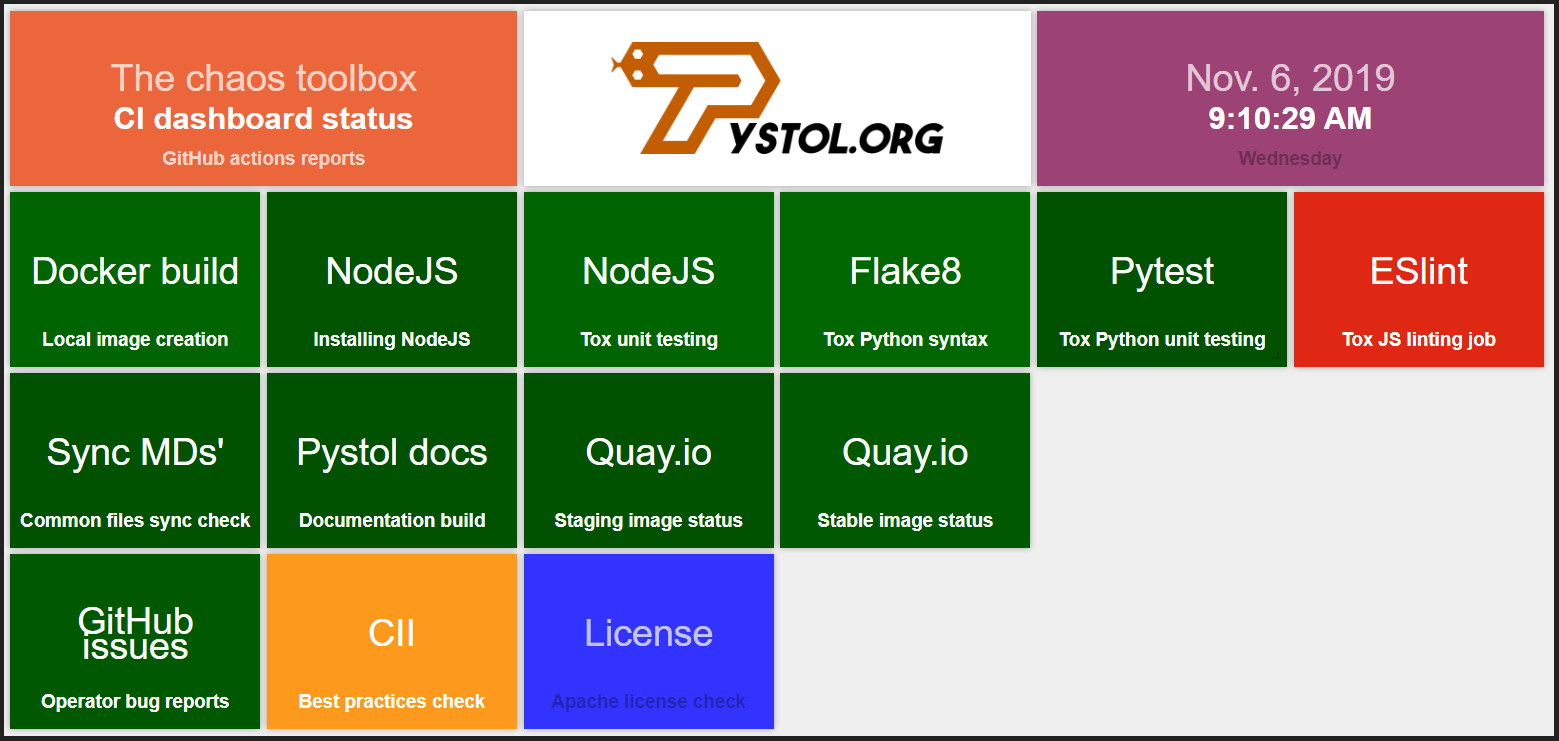
Badgeboard is an awesome information radiator to show the status of the badges you have in your project as a widget-based dashboard, in particular it’s the main CI dashboard of Pystol.
Is a very simple tool that converts the information inside any SVG badge you define from any source in a widget-based dashboard.
Demo
Just open the index.html file and see how the dashboard is rendered.
Requirements
None! Just clone the repo and open the index.html file in your favorite browser.
Once you have a copy, make the adjustments to the configuration file located in assets/data_source/badges_list.js to use your own badges.
Note: Due to CORS restrictions, badgeboard uses a proxy to add cross-origin headers when building the widgets panel. Check additional information about the CORS proxy on NPM.
How it works
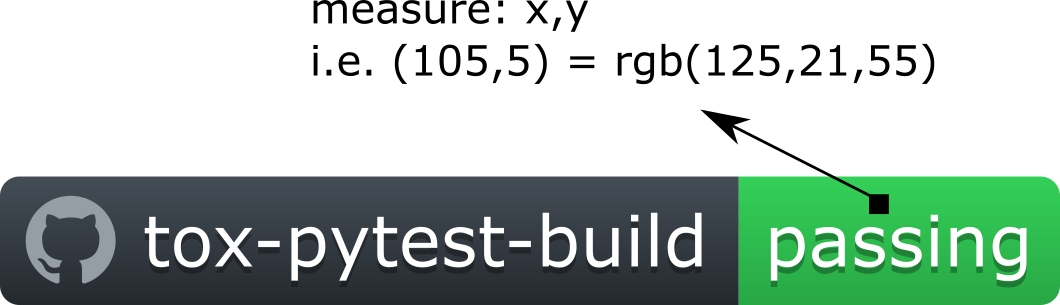
We capture the badges list (SVG files) and we read the color information from a single pixel, from there, depending on the color of the pixel the widget is painted with its corresponding color.
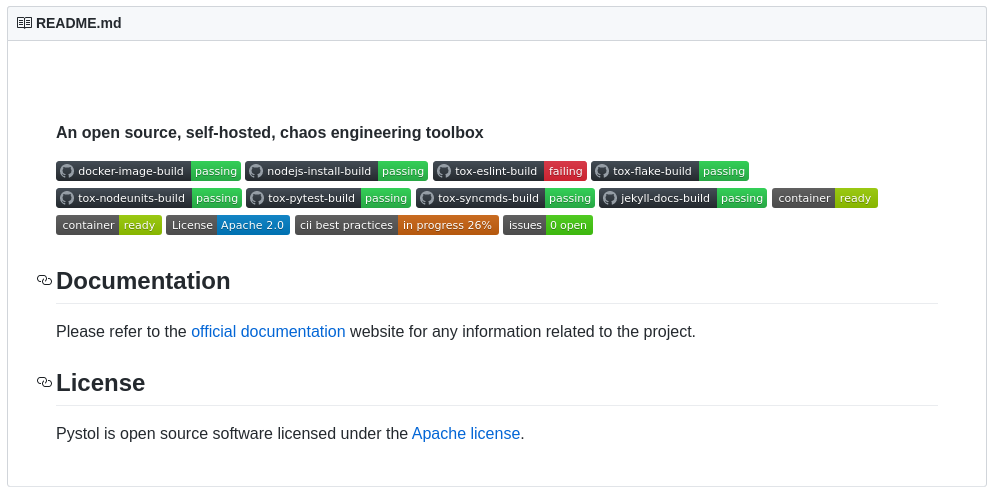
This would be the usual view of the project badges.
Adding your badges and colors
Use the coordinates_testing.html file to determine based on the SVG coordinates the RGB color to be used in the JS configuration file.
To do so, copy the link to your badge, find the badge example in the file, replace it with yours, open the file in a browser, get the console logs and move around the mouse over the badge to see the coordinates and the RBG color that matches it.
Adding custom color badges
To add new colors, edit the assets/css/custom.css file and add new color definitions for the widgets. Once you define the new color, in the configuration file called assets/data_source/badges_list.js use the new color like in the following example.
colors:[['<new_color_definition','<matching_rgb_from_the _badge>'],['status-good','48,196,82']],
Troubleshooting
If the board does not render correctly (No widgets at all) it’s for sure that you refreshed too many times the page. We use a CORS proxy to add cross-origin headers when building the widgets panel.
The requests it can handled are limited in order to avoid crashing the container, so we can all use it.
Please read the requirements and use your own NPM proxy so these restrictions go away.
References
We use both smashing and gridster to create the dashboard and its widgets.
License
Badgeboard is part of Pystol and Pystol is open source software licensed under the Apache license.
Next steps
It would be awesome to get some feedback around the tool, so, please feel free to file issues, pull requests or comments in this post or in the Badgeboard repository.
List of TO-DOs
There are still some bits to fix in Badgeboard for example:
Make the link from the widgets to work.- Move common hardcoded bits into variables for an easier update.
- Improve the documentation.
Updated 2019/12/04: Initial version.
Responses
Want to leave a comment? Visit this post's issue page on GitHub (you'll need a GitHub account. What? Like you already don't have one?!).